Industry Group Strength
Tradingview Indicator
Description
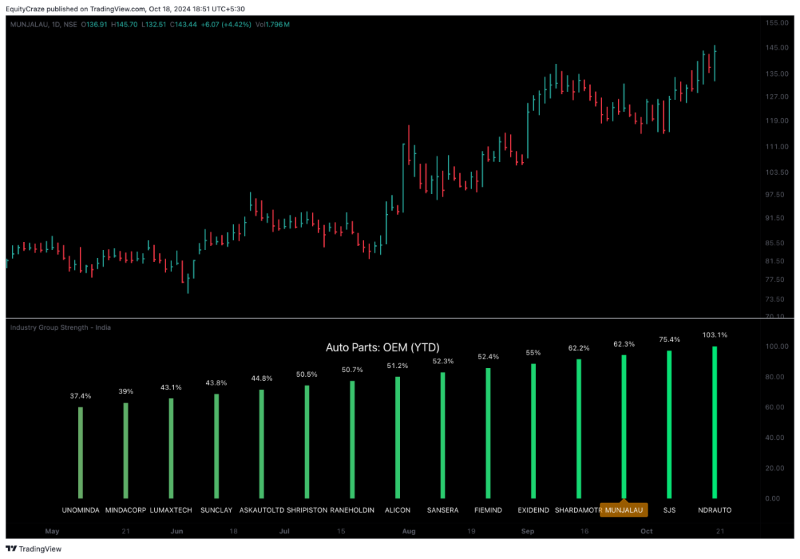
Presenting the Industry Group Strength Indicator for India market, designed to help traders identify top-performing stocks within specific industry groups that are predefined.
⦿ Identifies Leading Stocks in Industry Groups ⦿ Analyzes the following metrics:
- YTD Return: Measures stock performance from the start of the year.
- RS Rating: Relative Strength rating for user-selected periods.
- % Return: Percentage return over a user-selected lookback period.
Features
This indicator dynamically recognizes the industry group of the current stock on the chart and ranks stocks within that group based on predefined data points. Traders can add this indicator to focus on top-performing stocks relative to their industry.
Color-coded for Easy Visualization
You can choose from the following key metrics to rank stocks:
- YTD Return
- RS Rating
- % Return
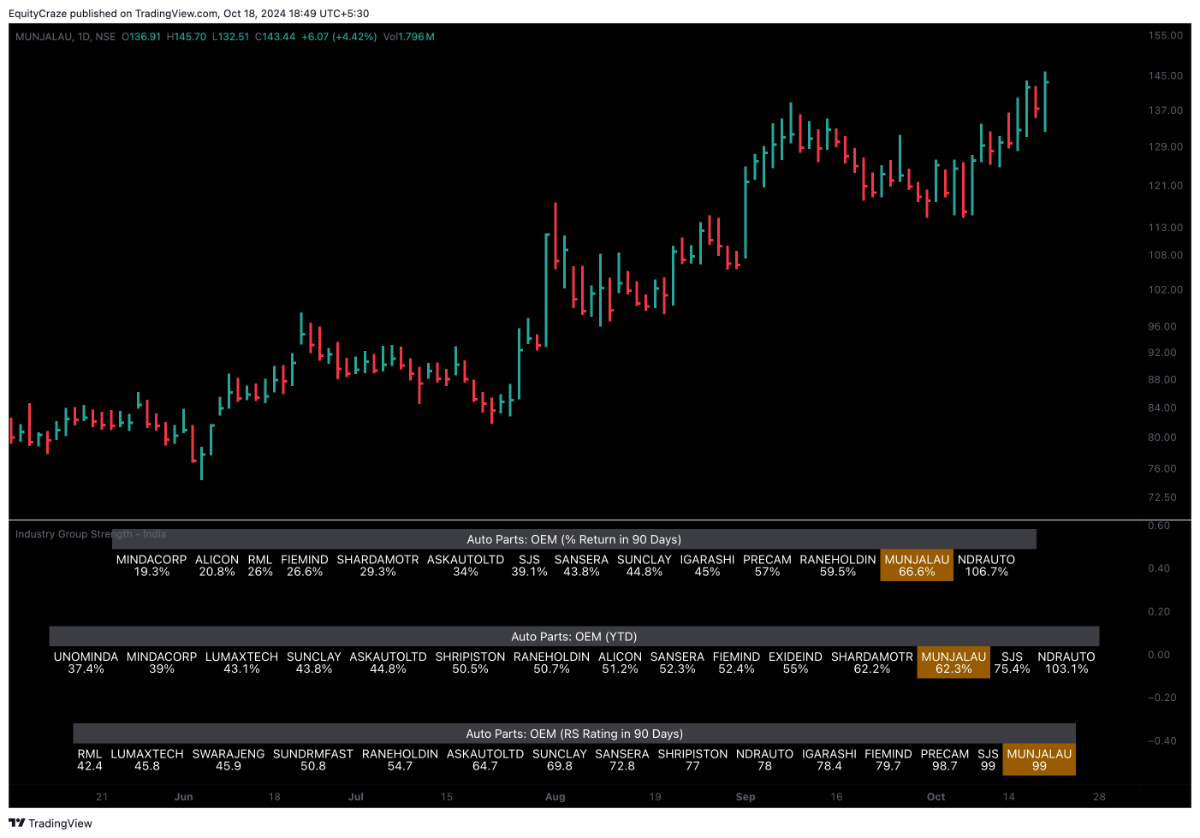
Table Format with Performance Metrics (Compact Mode)
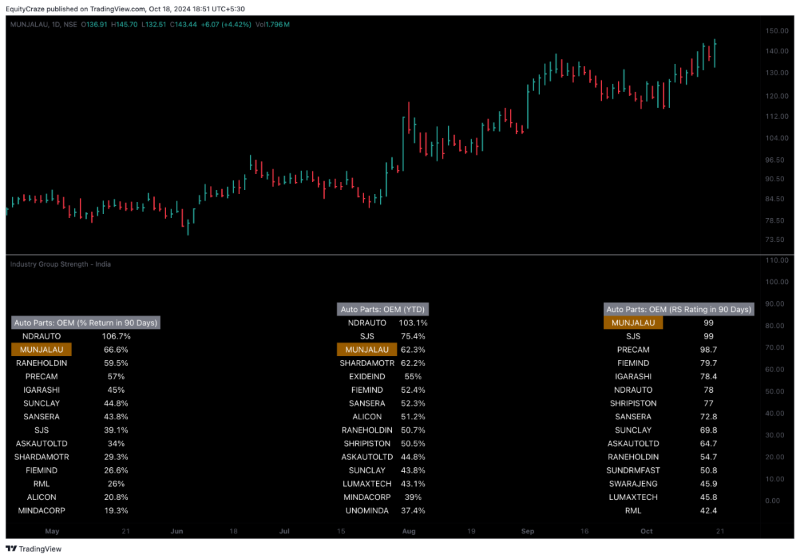
- Vertical View
- Horizontal View
All of the three metrics are shown in the compact mode and the current stock that is viewed is highlighted.
Vertical View
Horizontal View
Stock Ranking
Stocks are ranked based on their performance within industry groups, enabling traders to easily spot leaders and laggards in each sector. Color-coded gradients visually represent the stocks’ performance rankings, with higher percentile rankings indicating better performance.
Relative Strength (RS)
Relative Strength (RS) compares a stock’s performance against the benchmark index. The RS value is normalized from 1 to 99, making it easier to compare across different stocks. A rising RS value indicates that the stock is outperforming the market, helping traders quickly gauge relative performance within industry groups.
Limitations
At the time of developing this indicator, Pine requests are limited to 40 per script, so the predefined symbols had to be filtered to 40 per industry group.
Stock Filters
Filters that are used to filter the stocks in an industry group to a maximum of 40 stocks.
⦿ Auto, Chemical, Engineering, Finance, Pharma
- Market Cap ≥ 1000 Crores and Market Cap ≤ 60000 Crores
- Price ≥ 30 and Price ≤ 6000
- 50 Days Average (Price × Volume) ≥ 6 Crores
⦿ For the rest of the Industry Groups
- Market Cap ≥ 1000 Crores and Market Cap ≤ 100000 Crores
- Price ≥ 20 and Price ≤ 10000
- 50 Days Average (Price × Volume) ≥ 3 Crores
Credits
- This indicator is forked from the Script for the US market by @Amphibiantrading. Thanks to Brandon for the beginning of this indicator.
- This indicator is built on TradingView’s new dynamic requests feature. Thanks to @PineCoders for making this possible!


